Market research and analysis are core elements in the quest for an effective business strategy. Understanding your market through detailed scrutiny gives birth to significant insights that can help firms gain a competitive advantage. Analyzing the market, however, can result from diverse strategies and tools. One of these essential tools is the use of technical indicators. Technical indicators are mathematical calculations based on a security’s price and volume. Introducing the second part of the concept, let’s understand the role and implementation of technical indicators in market research and analysis.
Technical Indicators Defined
Technical indicators serve as a tool to traders forecasting both short-term and long-term market trends, offering a crucial edge to those who use them correctly. These indicators are mathematical calculations grounded in the price and volume of a security. They also provide graphical representations of these computations and accentuate the market’s direction, strength, momentum, and volatility.
Role of Technical Indicators
The use of technical indicators in market research and analysis play numerous influential roles. Predominantly, they serve to aid traders in identifying the momentum of the market, which simply implies whether the price of a security or stock is increasing or decreasing.
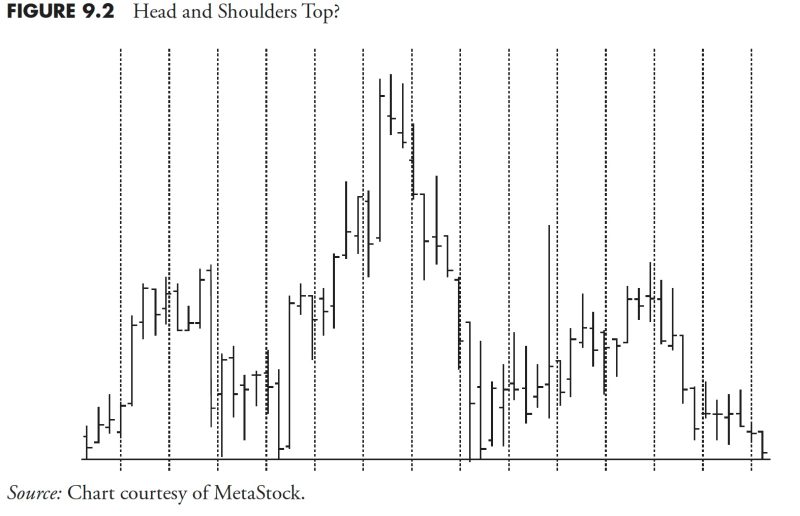
Further, technical indicators help visualize price patterns or market trends, assisting investors in anticipating a change in market behavior. They also assist in predicting whether the security price or stock is overbought or oversold, helping analysts to anticipate a price correction.
Types of Technical Indicators
The list of technical indicators is rather extensive, but we’ll look at a few key types.
1. Moving Averages: The moving average is likely one of the best-known technical indicators. It smooths out price data by perpetually creating an updated average price, providing investors a clearer image of the overall trend.
2. Relative Strength Index (RSI): The RSI evaluates the speed and variation of price movements, identifying when the security is overbought or oversold. This can aid in predicting a future price reversal.
3. Bollinger Bands: This type of technical indicator comprises of a middle band, along with two outer bands functioning as the levels of support and resistance. Bollinger Bands are designed to identify high or low pricing levels and price patterns.
4. Moving Average Convergence Divergence (MACD): The MACD is both a trend and momentum indicator. It can reveal changes in the strength, direction, momentum, and duration of a trend in a stock’s price.
Using Technical Indicators
To efficiently use technical indicators, traders need to comprehend what the calculations represent and the best manner to respond. Not every indicator will be useful or align with your strategy, henceforth it’s significant to choose an appropriate tool on the basis of volatility, volume, popularity, and complexity.
For instance, if a market researcher is interested in predicting future price movements, tools such as Moving Averages and MACD would be useful. On the other hand, to identify overbought or oversold market conditions, the Relative Strength Index could be employed.
Despite the numerous advantages offered by technical indicators, market researchers should continually remember that they are tools and not crystal balls. They should be used in conjunction with a comprehensive analysis and solid trading strategy.
In essence, technical indicators provide another perspective to augment our understanding of trades and potential market patterns, offering a mathematical approach to market research and analysis. They are not perfect, but they can offer valuable insights that can steer decisions, assuming they are used appropriately and based on a careful understanding of their strengths and limitations.
