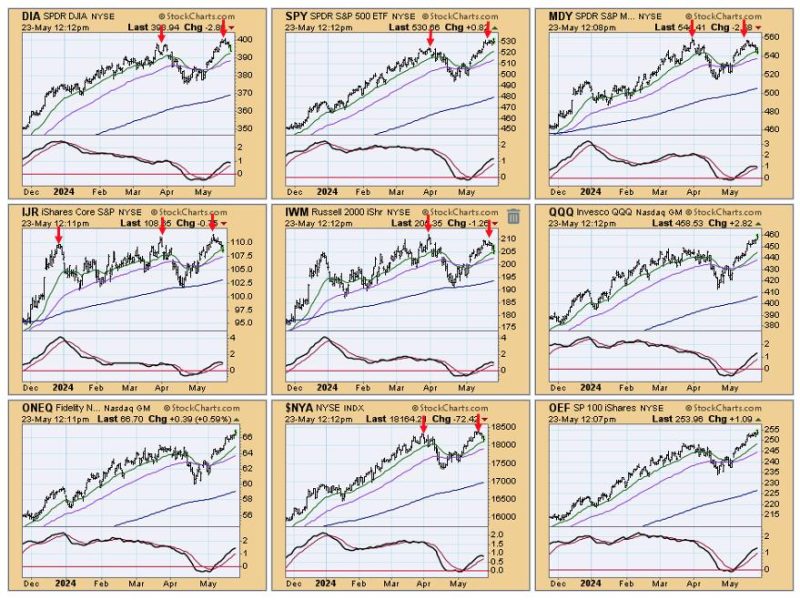
The stock market’s performance is a calculated combination of economic indicators, investor sentiment, and individual company’s abilities to generate profits. In its everyday dance, sometimes, the market reaches what traders refer to as a ‘top’ or more colloquially, it appears ‘toppy’. This condition is identified when the stock market’s prices are near their historical highs, characterized by overstretched valuations and opinionated speculation driving this inflationary price spiral. Indeed, a toppy market can signal the onset of a downturn, yet it can also represent a mere pause before a continued market rally.
Comprehending the mechanisms behind a toppy market is critical for investors who wish to make informed trading decisions. While multiple indexes reflect the overall market’s health, two widely adopted ones include the Dow Jones Industrial Average (DJIA) and the Standard & Poor’s 500 (S&P 500). When these indexes touch all-time highs, create new resistance levels, and exhibit strained gravity-defying trends, knowledgeable investors start questioning the sustainability of such fast-paced growth and start bracing themselves for possible trend reversals or corrections.
Fundamental analysis plays a significant role in identifying a market top. A toppy market commonly aligns with high Price to Earnings (P/E) ratios, declining profit margins, and increasing company debt. When these elements align, it suggests that stock prices may not be backed by solid financials. Instead, they are often propped up by investor exuberance and speculative actions. This unsustainable path caused by ballooning valuations and weakening fundamentals often heightens the risk levels, pushing the market into overbought territory.
Another key indicator of a toppy market is the unusual behavior of investors. In a toppy market scenario, retail and institutional investors alike tend to exhibit heightened optimism, often pushing stock prices higher– despite underlying fundamentals no longer supporting them. This investor behavior, typically driven by the Fear of Missing Out (FOMO), exacerbates the irrational exuberance that precedes a market peak.
On the technical analysis front, overbought indicators like the Relative Strength Index (RSI) and Bollinger Bands, offer objective measures that can help identify a toppy market. For instance, an RSI value over 70 suggests an overbought condition, potentially signaling a reversal or slowdown in trend. Similarly, when a stock’s price consistently interacts with the upper Bollinger Band, it signifies an overbought market.
While top economists and seasoned market professionals might argue that it’s almost impossible to accurately pinpoint and predict market tops and bottoms, indicators discussed above provide valuable insights and assist in spotting a potential market top. Hence, when one detects a market gradually cruising towards its peak, reducing exposure to riskier assets, diversifying portfolios, and hedging positions with alternative investments gradually becomes a preferred strategy.
However, it is necessary to approach this condition with caution, as false alarms can also be triggered. Market looks ‘toppy’ is construed repeatedly as a dire flag, prompting quick exits. Often, these can be premature, given market delirium can stretch far beyond logical comprehension. The famous economist, John Maynard Keynes, once proclaimed, The market can remain irrational longer than you can remain solvent.
Therefore rather than panic selling or going full bearish, a thoughtful, studied response to the toppy market scenario is recommended. Adopting a more defensive approach, rebalancing portfolios with a volatility-adjusted perspective, and awaiting clear confirmations can be an antidote to avoid potential risks and maximize profits in a toppy market situation. As with any market condition, the wise investor maintains a disciplined strategy, responds, not reacts, and above all, guards against the potential ‘fall from the top’.
